The analysis is based on the results of a test run from 01.01.2020 to 2024.12.2020 using ChatGTP
1. Profitability
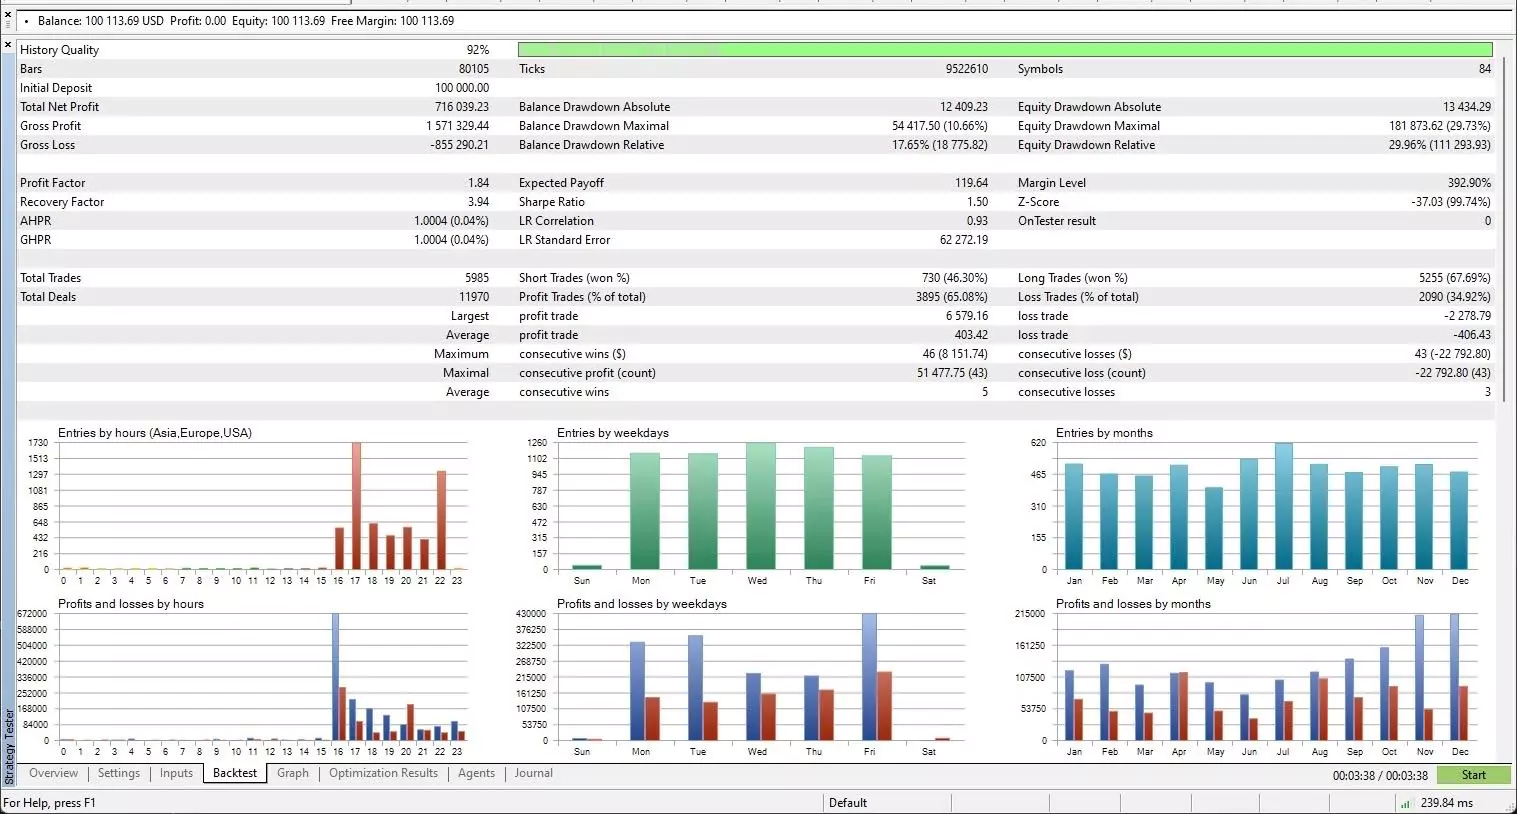
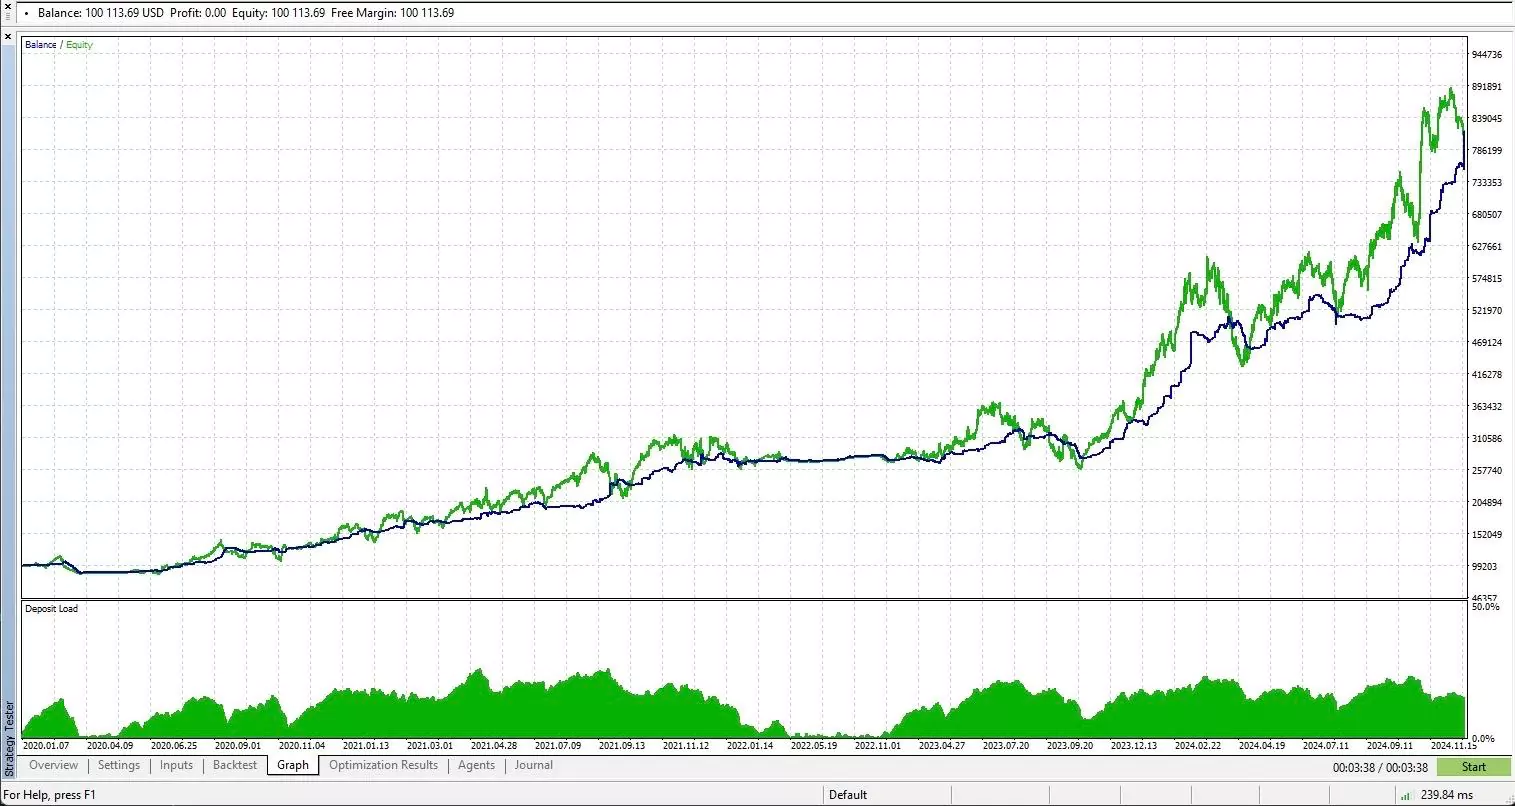
Total net profit: $722,491.92 – Strong total profit for the period.
Gross profit: $1,537,769.30 vs. gross loss: $815,277.38 – The profit factor of 1.89 means that for every dollar lost, the bot makes a profit of $1.89. This is fair, as a profit factor greater than 1.5 is generally considered profitable.
Expected profit: $143.04 – The average profit per trade is positive, indicating that the strategy has been consistently profitable over time.
2. Risk Management
Declines:
Balance sheet decline maximum (absolute): $59,050.95 (19.22%)
Equity decline maximum (absolute): $137,312.27 (24.24%)
These declines are moderate and acceptable for high-yield schemes, but indicate that there are periods of significant risk. The 34.32% relative capital decline is on the higher side and could be improved for long-term sustainability.
Recovery factor: 5.26 – This is excellent. It indicates that the stick is effective in recovering losses, as it generates 5.26 times the maximum return as profit.
3. Efficiency
Sharpe ratio: 1.50 – Strong Sharpe ratio, indicating a good risk-adjusted return. Values above 1.0 are considered efficient.
AHPR and GHPR: 0.04% per trader – This is a modest growth rate, but the consistency between AHPR and GHPR reflects the low volatility of trading performance.
Linear regression correlation (LR correlation): 0.92 – Indicates a strong positive trend in capital growth over time.
4. Profit ratio
Winning trades: 70.92% – High win rate, which is consistent with the bot’s ability to make profits.
Average win vs. loss trades:
$429.30
Average loss: $-551.70
The bot wins more often, but loses more per losing trade on average. This suggests that it relies on a high win rate to maintain profitability, which can be risky in volatile conditions.
5. Trade statistics
Total trades: 5,051 – Sample size sufficient for reliable statistics.
Biggest winning trade: $6,772.42 vs. Biggest losing trade: $3,019.73 – Biggest loss is smaller than the biggest win, which is a good sign.
Average consecutive wins/losses: 7 wins vs. 3 losses – This indicates that traders tend to make a series of winning trades.
6. Consistency
History quality: 92% – Indicates reliable backtest data, although accuracy could be improved by approaching 99% quality.
Z-score: -34.80 (99.74%) – Suggests that trades are not random, a positive indicator of systematic advantage.
Concerns
Equity Decline (Max): The absolute decline of 24.24% and relative decline of 34.32% is quite significant and could pose a risk to the account in adverse market conditions. To reduce downturns, consider optimizing position sizing, stop-loss rules or diversification.
Average loss > Average gain: The strategy can be vulnerable if the win rate decreases, as losing trades cost more than winning trades on average.
Risk per trade: The bot appears to have a relatively high risk tolerance. Fine-tuning the risk per trade can improve stability.
Strengths
Profitability: strong net profit and good return.
Efficiency: high Sharpe ratio and good AHPR/GHPR.
Consistency: high win rate with strong Z-score and low trading randomness.
Trend following: high LR correlation indicates steady growth.
Suggestions for improvement
Reduce downturns:
Introduce tighter stop-losses or trailing stops.
Optimize leverage to reduce equity exposure during large market swings.
Improve risk-reward ratio:
Adjust take-profit levels or reduce risk exposure to bring average gain closer to average loss.
Optimising risk per trade: Use position sizing strategies to balance returns and downturns.
Diversification: to reduce stock volatility, consider using trading strategies or instruments with lower correlation if you have not already done so.
Summary
Your bot has strong profitability and efficiency, but could improve risk management for long-term sustainability. With some optimisation, it could become a more robust and scalable system.
